THE FUTURE OF CX IS DATA DRIVEN AND WITH CHATPANDAS, YOU’RE ALREADY THERE.

With our latest technology and data driven reports, you’ll get to know more about your processes, marketing strategies, your customers and how well you can serve them.

Book A Demo

Conversations Report

When you have a global presence, your customers may contact you from any region of the world. This makes 24/7 customer service essential to your business.

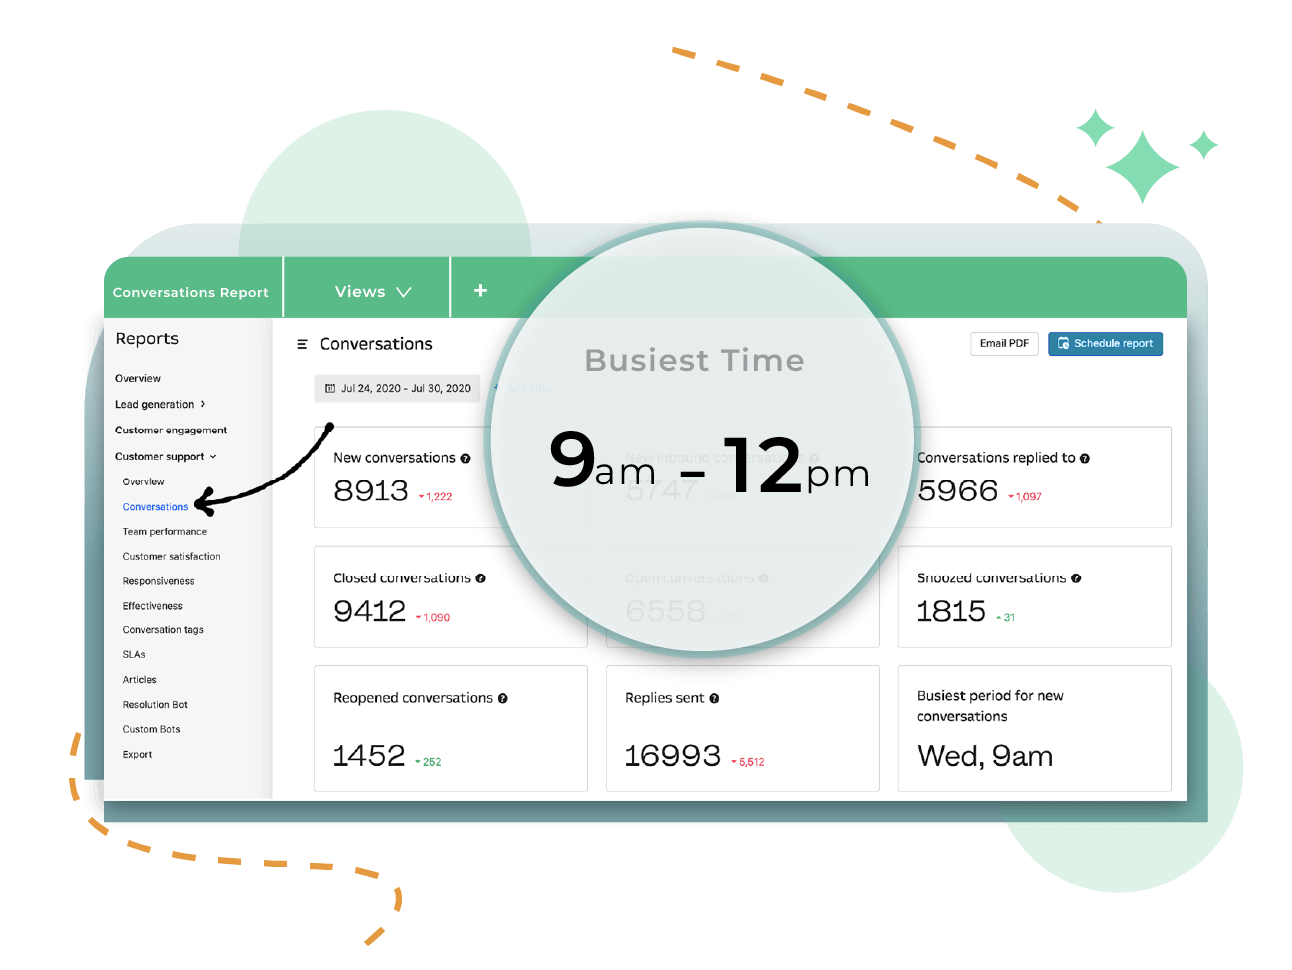
We provide omni channel customer support, 24/7 always-on customer service and operators with a friendly voice, ready to help out your consumers, day or night, rain or shine. Our conversation report includes service level, busiest hours, agent’s schedule, workflow report, resolution time chart, average first response, average first resolution and total number of tickets etc.

Our creative, out of the box solutions and conversations with your customers that paves the way for new customer experience are a part of this conversations report.

Actionable Data Report

Our data reports contain actionable insights that lead to better actions, improved customer experience and data driven problem solving. Our actionable data report contain analysis of your lead, converted leads, customer retained, total sales, upsell and cross sell opportunities and number of customers acquired.

Actionable data reports help you plan marketing campaigns, sales processes, change product/services based on consumer needs and the feedback acquired. These reports also include email open rate and email click through rate which helps us take action and design better email template and content. Our detailed reports help us predict the success of future marketing campaigns, email campaigns, sales trends and predict ROI.

Productivity Analysis Report

Productivity refers to the number of support tickets handled by the total number of agents in a specific time compared to an organization’s KPIs.

To measure productivity we include First Contact Resolution rate, Average Handling time, CSAT score, Resolution Rate, ticket backlog, total number of tickets, forecast accuracy, service level and many other metrics. Tracking productivity and making productivity analysis report may seem like a daunting task but that makes it all the more important. Productivity analysis makes it easier to understand the productivity level of all the resources and gets us one step closer to increase it.

Customer Happiness Report

Customer happiness is solving the queries of customers not only as quickly as possible, but also as completely as possible. It involves going the extra mile for your customers and providing them with a ‘wow experience’ Our customer happiness report include the needs of the customer and include analysis of how to add value at each touch point of a customer journey, what involves in making customers delighted and which strategies have failed to work.

Our feedback strategy takes the cake here as we collect data from the customers and list what they want and take it from them as to how to improve our processes. Unhappy customers are our biggest resource of learning and we actually welcome complains as it means we have a chance to learn what has not been working and there is still hope that we can retain that customer.

Knowledge base report

Our knowledge base reports analyze your knowledge banks and if they have sufficient information. We make suggestions to optimize your user experience and how your knowledge banks can be quick and easily accessible to your consumers.

We suggest improvements based on the content searched and how to use searched keywords to improve the content of your knowledge banks. This also include giving your users suggestions, so it is even easier for them to navigate your knowledge base. If your consumers search some keywords and fail to find the answers for those, we collect that data and make sure to include it. Updating knowledge bases takes the burden off of your customer service reps and even improve customer happiness.

Marketing success report

In our marketing success report, we collect marketing metrics to help make marketing decisions, optimize marketing strategies and predict future marketing trends aligning with the overall goal of your business. We help you analyze which marketing campaigns have been the most successful and which campaigns have failed to yield results. We categorize tickets based on marketing campaigns, track sales, identify generated and converted leads and calculate customer interactions and total sales to gauge the efficacy of marketing campaigns.

Our marketing success report include data of email campaigns, upsell and cross sell opportunities, visitors who visited your website, downloaded your whitepapers, signed up for your newsletters and total acquired customers.

Traditional metrics report

Traditional contact center metrics report analyze the operational growth, overall efficacy and agent productivity and call center success. Traditional metrics include response time, agent productivity, resolution rate, first contact resolution, satisfaction score, net promoter score, service level, forecast accuracy, agent utilization and adherence to schedule etc.

We not only divide our benchmarks into individual and team level, but we also track them consistently over a specific amount of time to track, measure and improve results. We measure non quantitative things like empathy and effective communication as well. Scoring and monitoring these benchmarks pinpoint the deficiencies in agent performance and gives us a clear path to improve them

Drip campaign analytics

We not only divide our benchmarks into individual and team level, but we also track them consistently over a specific amount of time to track, measure and improve results. We measure non quantitative things like empathy and effective communication as well. Scoring and monitoring these benchmarks pinpoint the deficiencies in agent performance and gives us a clear path to improve them

We not only divide our benchmarks into individual and team level, but we also track them consistently over a specific amount of time to track, measure and improve results. We measure non quantitative things like empathy and effective communication as well. Scoring and monitoring these benchmarks pinpoint the deficiencies in agent performance and gives us a clear path to improve them

Meaningful. Personal. Human.

Your best moments in Customer Experience are here.